Evaluation Information Pathways and Resident Response Profiles
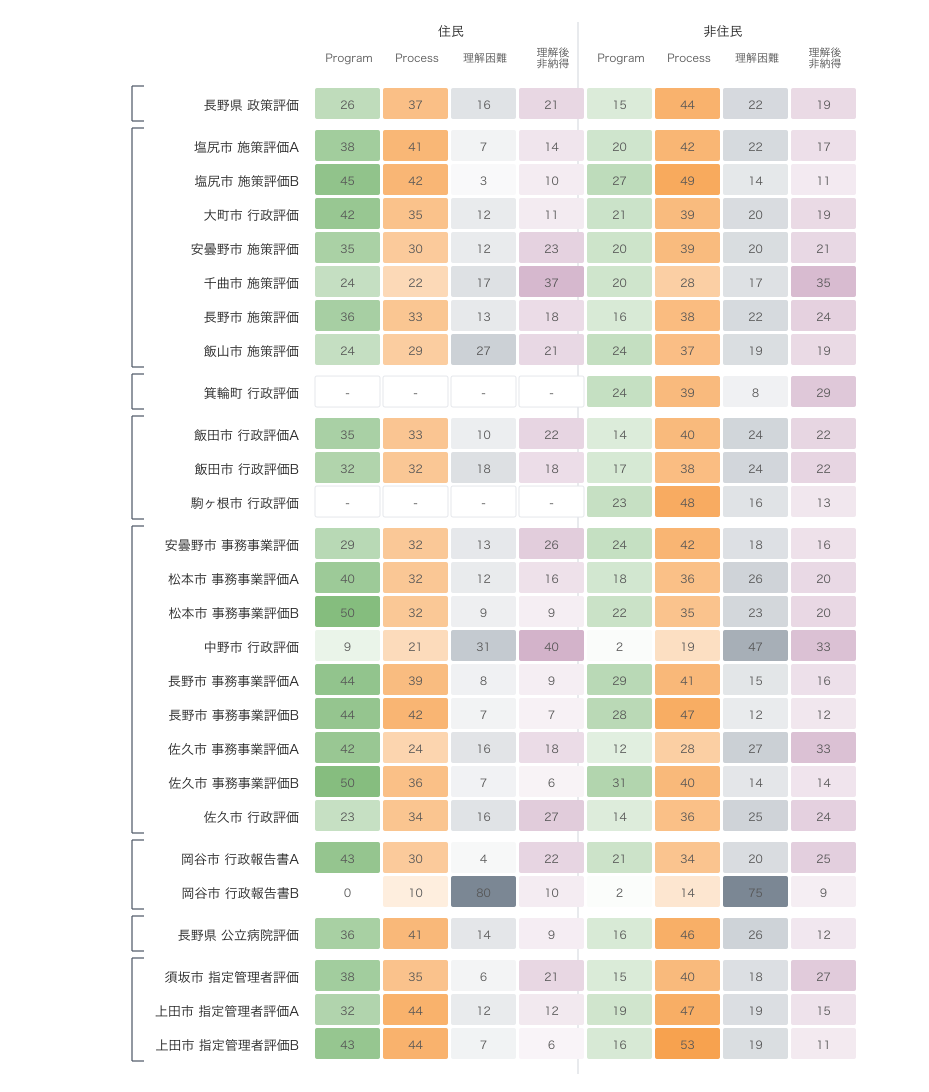
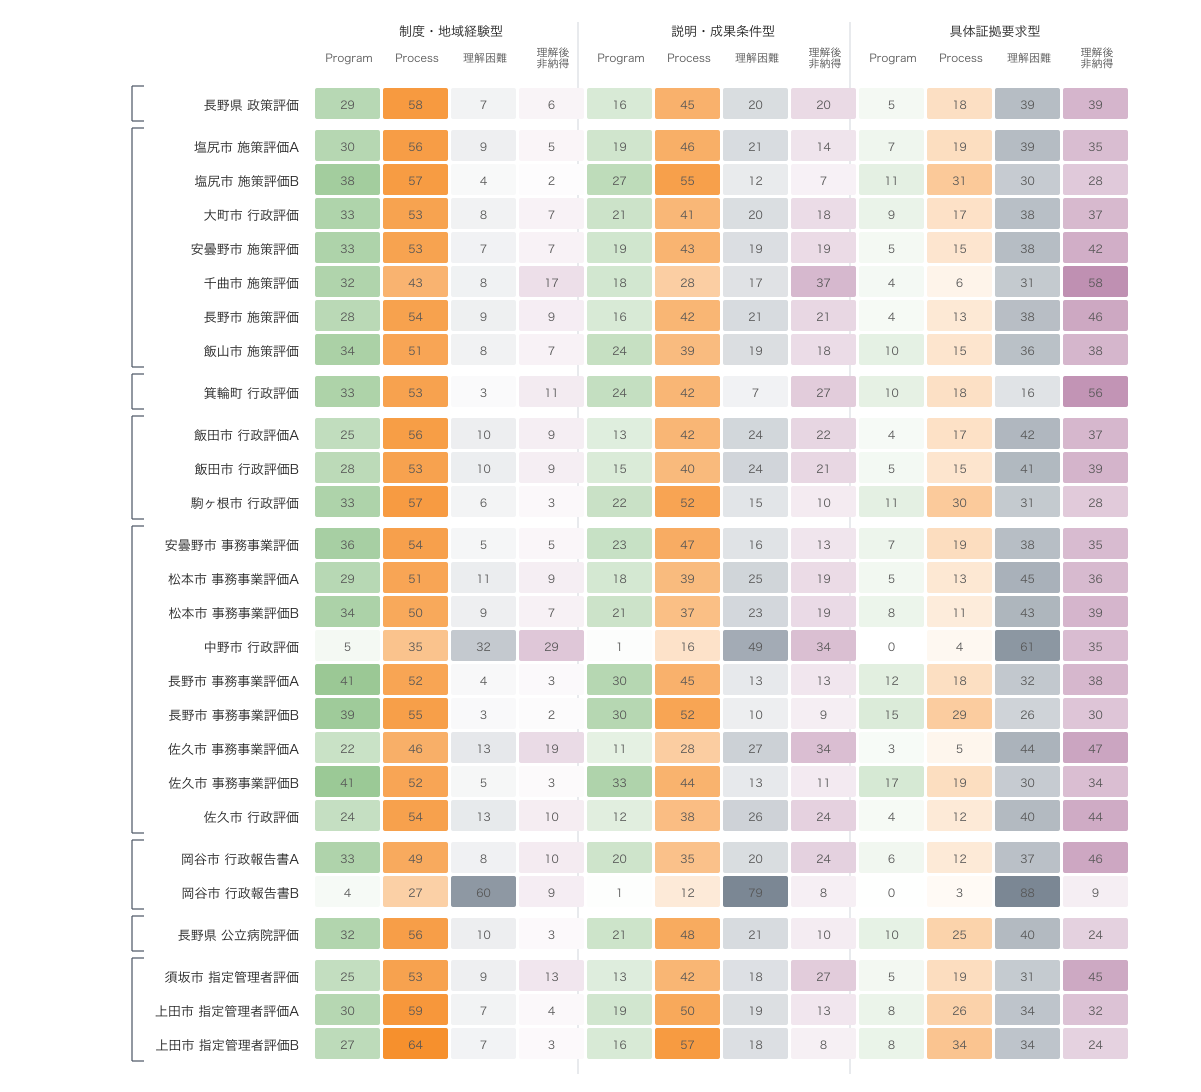
These supplementary figures visualize simulated resident responses by evaluation system, report, response type, and resident attribute. Values are composition ratios by report and attribute group. Program and Process responses may co-occur, so totals are not necessarily constrained to 100%.
Fixed Figures
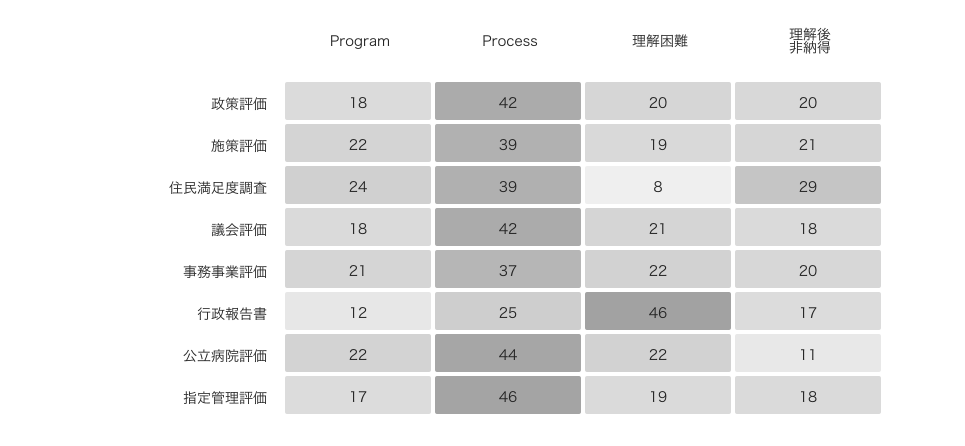
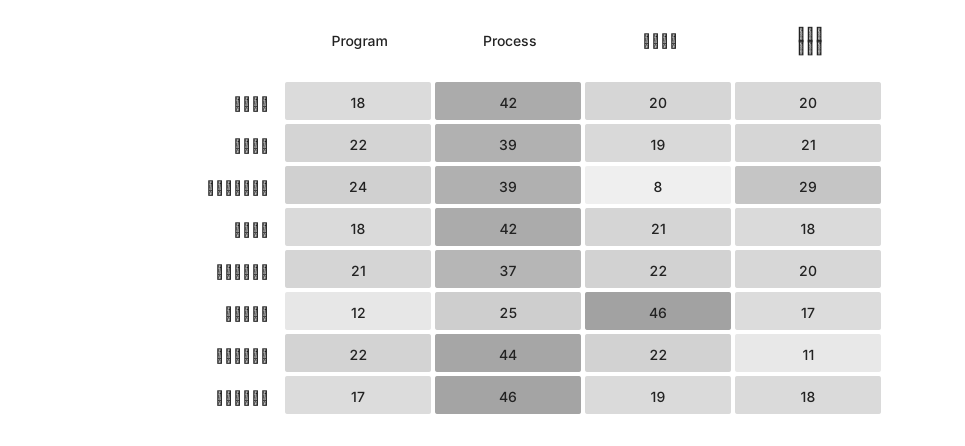
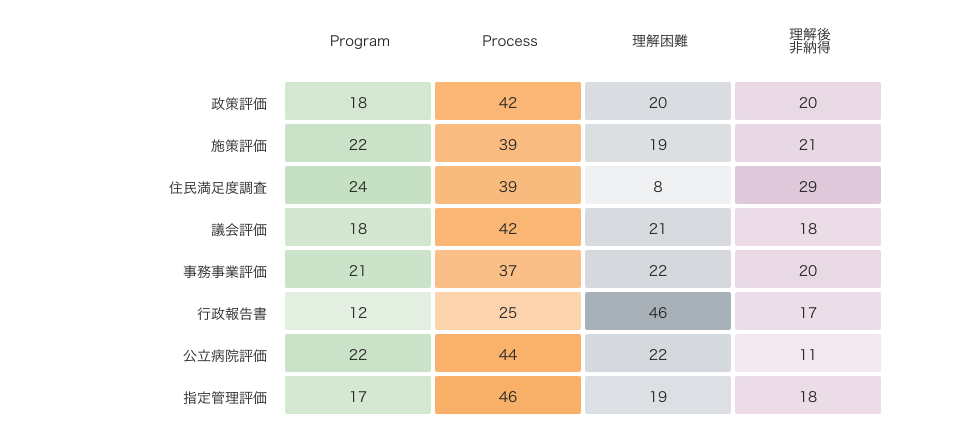
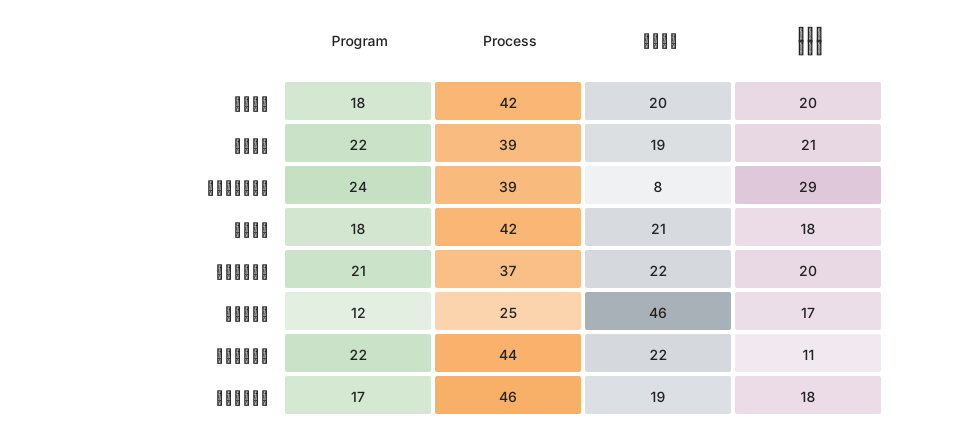
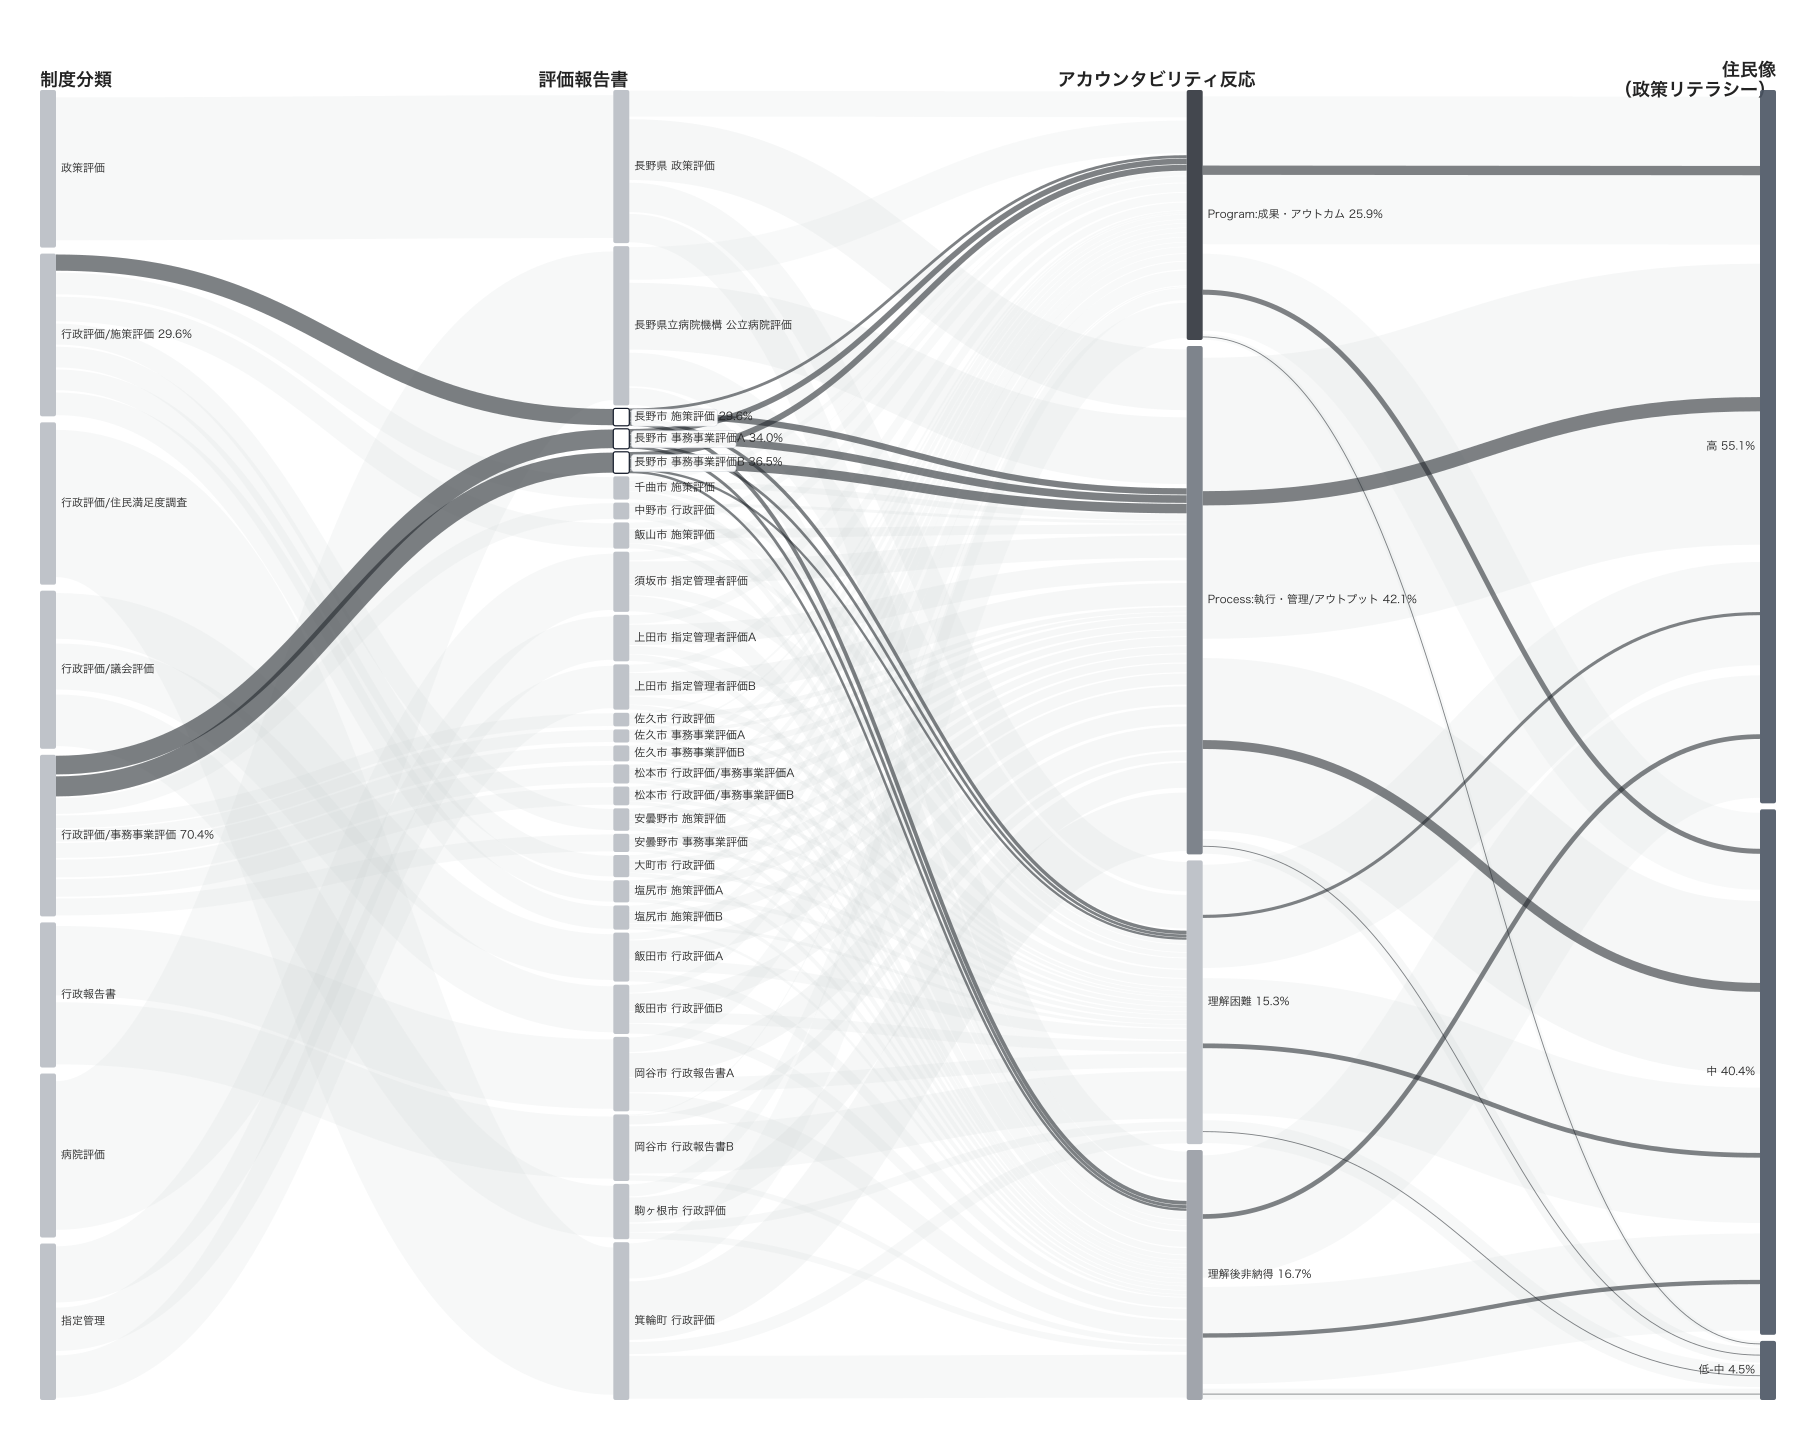
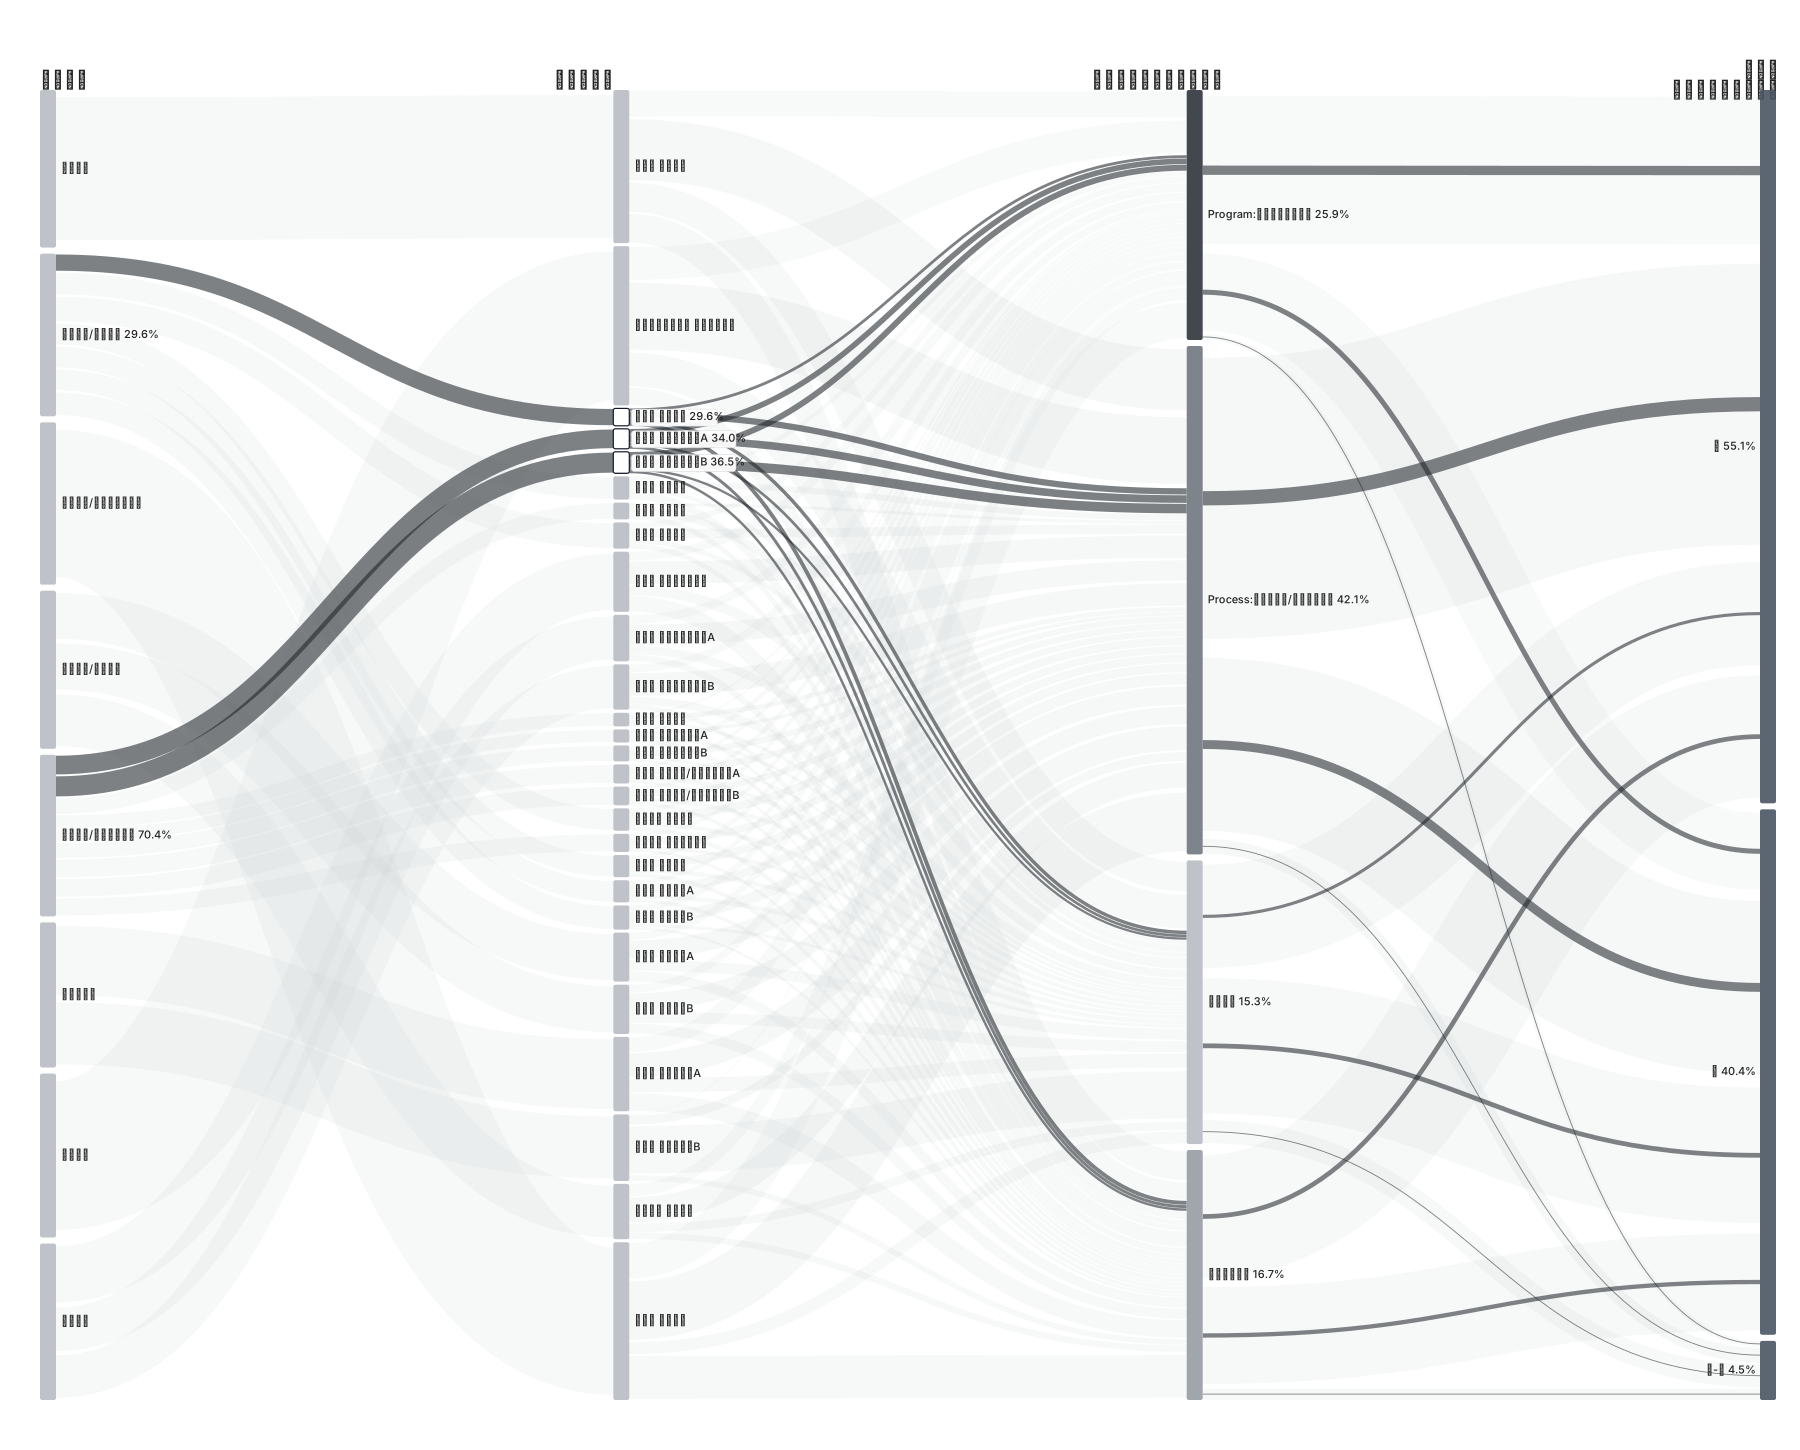
Figure 2
Evaluation Information Pathways
Nagano City Administrative Evaluation is highlighted.
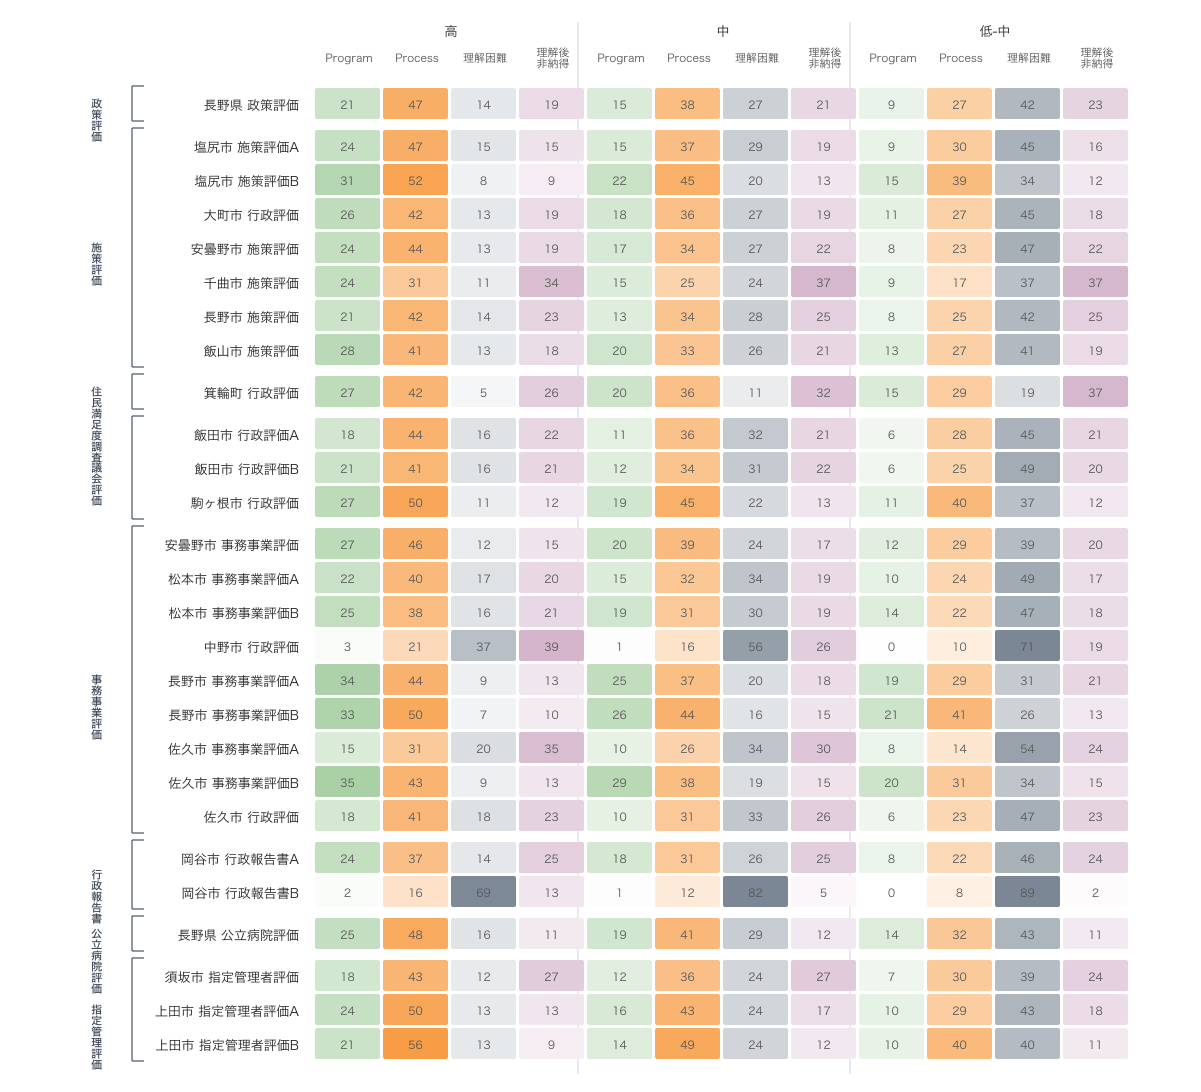
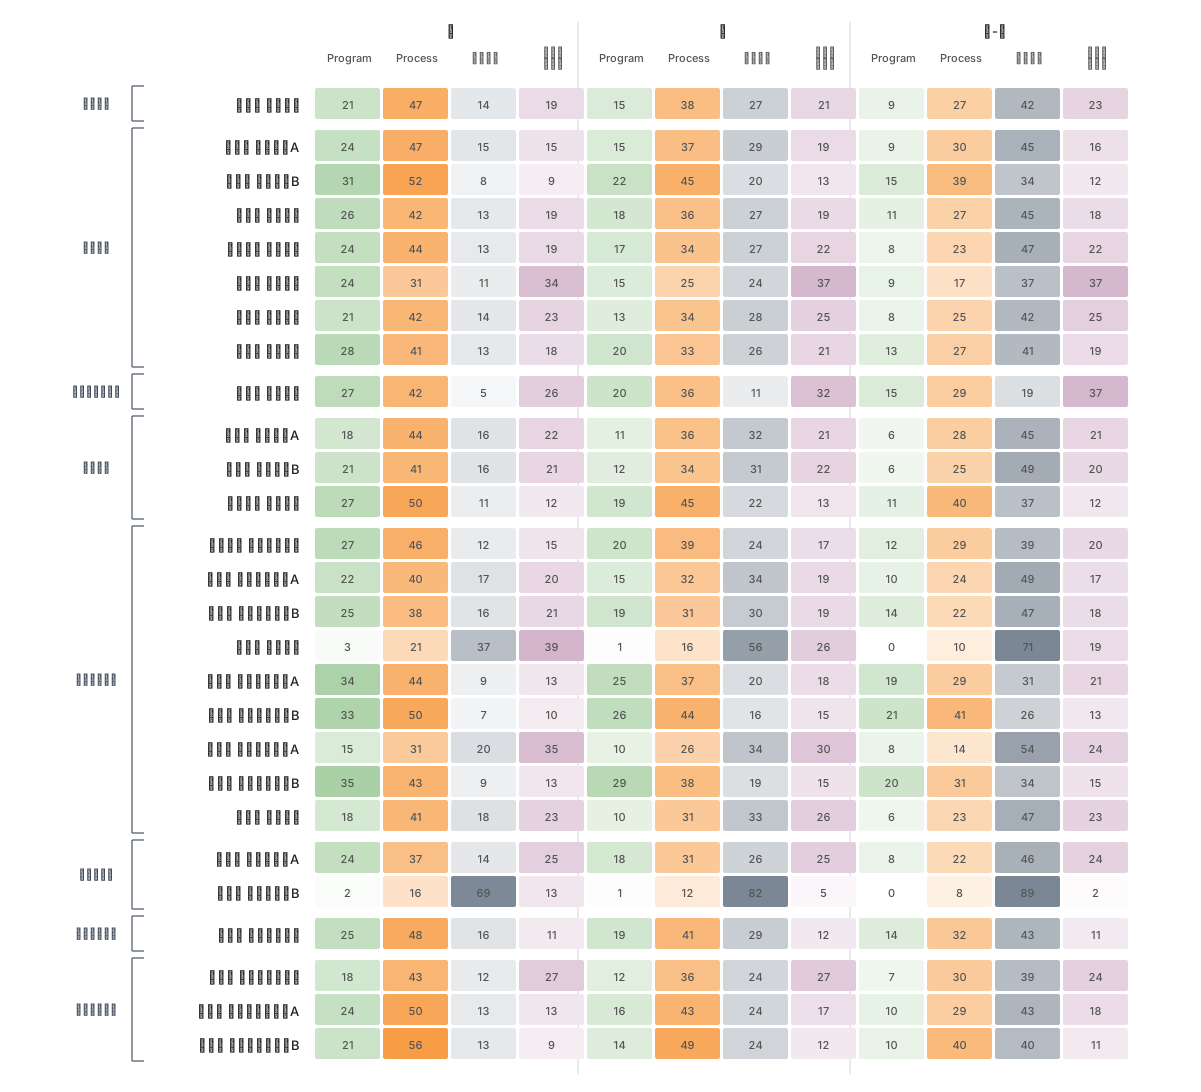


Data
The interactive figures load static TSV files in the browser and render SVGs. No analysis pipeline runs on this page.